SOUTH FLORIDA RESIDENTIAL REAL ESTATE MARKET STATISTICS APRIL 2022
What will happen to the South Florida residential real estate market in the second quarter of 2022? What are the main market indicators of the first month of the second quarter of 2022?
Investing in South Florida Real Estate Market
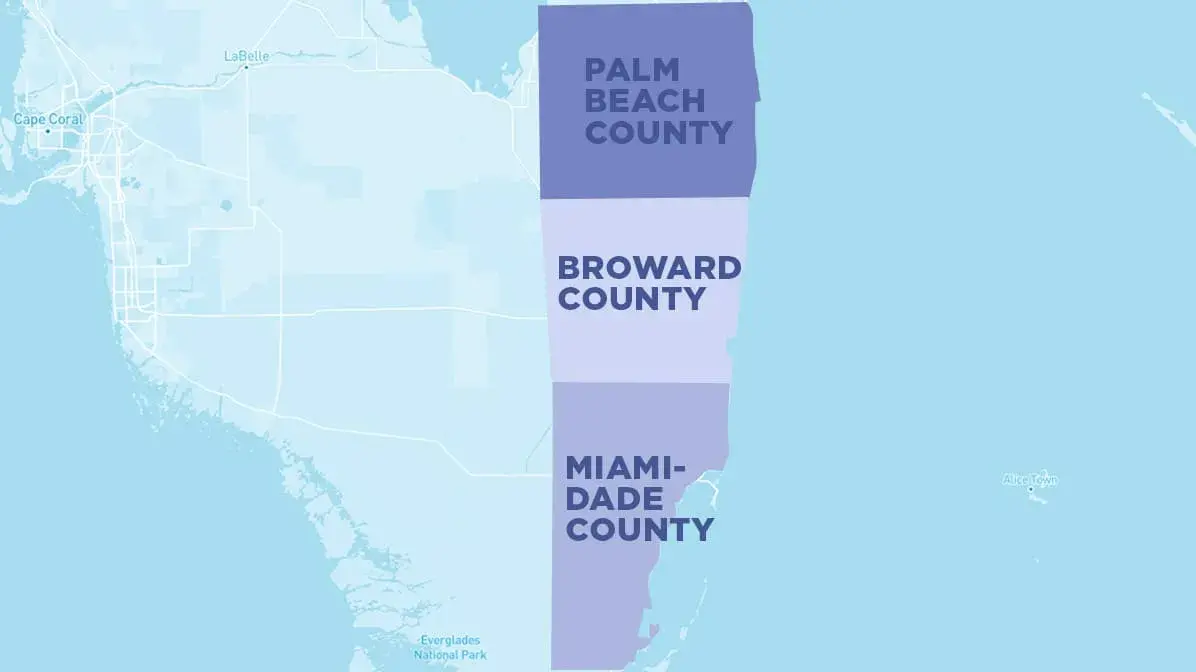
In a review of the statistics of the residential real estate market in South Florida (Miami-Dade County, Broward County, Palm Beach County), we refer to the opinion of NICK POLYUSHKIN, an expert, broker of the real estate company VERA REALTY, which has been working in this market for more than 10 years
According to NICK POLYUSHKIN,by April 2022, "...the stock market had sunk somewhat. Since the beginning of 2022, one of the most important indicators of the market - the S&P 500 index - has fallen by 1,000 points." The ongoing changes indicate that some trends in the market are already being revised. "Literally, in the first week of May, investors with shares in the stock market lost quite a lot of money, and some of them were pushed back in their income to the level of 2021, now thinking about selling their shares and investing in new facilities."
From N.POLYUSHKIN's point of view, in general, "investing in residential real estate is a win-win method of working with assets, since the cost of housing increases along with inflation. The same applies to commercial real estate, although there are contractual difficulties there, and this type of real estate is not growing in price as fast as residential. There are quite a lot of options for using residential real estate: from living and renting, the cost of which has increased by 70% over the past few months, to its sale."
If we talk about the residential real estate market in South Florida, then after a relative lull in the last weeks of April - early May 2022, the demand for housing begins to increase significantly.
As for NICK POLYUSHKIN's opinion, the real estate market in South Florida is "...a unique market that differs from similar markets in other regions and states of the United States in that people still move to Florida for permanent residence or living for a long time. Therefore, the demand for residential real estate constantly exists."

Some indicators of the residential real estate market in South Florida
When analyzing the data of the residential real estate market in South Florida, there are a number of basic parameters used by the Miami Realtors Association (@miamirealtors.com), which clearly demonstrate the changes taking place.
These include such indicators as:
- closed sales
- paid in cash
- median sale price
- average sale price
- dollar volume
- median percent of original
list price received
- median time to contract
- median time to sale
- new pending sales
- new listings
- pending inventory
- inventory/active listings
- month's supply of inventory
It should be borne in mind that many market indicators depend on seasonal cycles, so the actual trends should be more accurately considered with changes over the year.
Let's analyze some April indicators of the residential real estate market in South Florida (Miami-Dade County, Broward County, Palm Beach County), comparing the data presented for April 2022 with data for the same month in the previous 2021
Closed sales
The indicator "closed sales" is one of the simplest, but at the same time the most important indicators for the residential real estate market. This parameter shows the number of closed (completed) transactions during the month.
If we take closed (completed) sales for single-family homes in Miami-Dade County, then in April 2022 they decreased by 21% compared to the previous April 2021. For townhouses and condominiums in the same district, a decrease of 7.4%. In Broward County, a decrease in single-family homes by 15.3%, and for townhouses and condos by 11%. In Palm Beach County, the rates of closed sales for single-family homes are -25.39%, and for townhouses and condos -27%. On average, transactions for singlefamily homes in three districts decreased by 20.56% in April compared to April 2021, and for townhouses and condos - by 15%.
| Some counties of South Florida |
Single-family homes |
Townhouses and condos |
|---|---|---|
| Miami-Dade, Broward, Palm Beach |
-20.56% | -15% |
Table1.The average value of the indicator "closed sales" in Miami-Dade, Broward, Palm Beach counties in April 2022 in comparison to April 2021
Paid in cash
The "paid in cash" parameter shows the number of completed closed transactions when the buyer paid exclusively in cash.This is an indicator of investor participation in the market. Often it is investors who use cash funds, unlike potential homebuyers who sometimes require additional financing or a mortgage when buying real estate.
Cash payments for the purchase of single-family homes in Miami-Dade County in April 2022 increased by 15.4% compared to the previous April 2021. For townhouses and condominiums in the same district, according to this indicator, an increase of 11.3%. In Broward County, a 16.7% increase in cash payments for single-family homes, and a 16.4% increase for townhouses and condos. In Palm Beach County, "paid in cash" rates for single-family homes increased by 20.5%, and for townhouses and condos by 9.8%. On average,"paid in cash" in three districts increased by 17.3% for singlefamily homes in April compared to April 2021, and by 12.5% for townhouses and condos.
| Some counties of South Florida |
Single-family homes |
Townhouses and condos |
|---|---|---|
| Miami-Dade, Broward, Palm Beach |
+17.3% | +12.5% |
Table 2.The average value of the indicator "paid in cash" in Miami-Dade, Broward, Palm Beach counties in April 2022 in comparison to April 2021
Median sale price
The median sale price is when several objects are selected from the total sales volume, let's say, three objects that are close in value and the average sale price is calculated for the month when 50% of sales were higher and 50% of sales were lower than the selected objects. Median sale price is not associated with high sale prices for a small number of houses, which may not be typical for the market of this area.
The median sale price on average for three counties (Miami-Dade, Broward, Palm Beach) of South Florida increased for single-family homes in April by 19.79% compared to April 2021, and for townhouses and condos - by 17.86%.
| Some counties of South Florida |
Single-family homes |
Townhouses and condos |
|---|---|---|
| Miami-Dade, Broward, Palm Beach |
+19.79% | +17.86% |
Table 3.The average value of the indicator "median sale price" in Miami-Dade, Broward, Palm Beach counties in April 2022 in comparison to April 2021
Median percent of original list price received
The indicator of the median percent of original list price received for the sold object is a useful indicator of assessing the market recovery. When it rises, buyers realize that in order to get a contract for a house, they will have to offer the originally stated price. The recent trend for South Florida: to reduce this offer will be almost impossible.
What we actually notice is an increase in the median percentage of the original stated price by 2% when purchasing single-family homes in Miami-Dade County in April 2022 compared to the previous April 2021. For townhouses and condominiums - according to this indicator, an increase of 4%. In Broward County, an increase in the median percentage of the original stated price for single-family homes by 1%, while for townhouses and condos an increase of 4.2%. In Palm Beach County, the median percentage of the original stated price per single-family homes increased by 2%, and for townhouses and condos by 4%. On average, in the three districts, the median percentage of the initial declared price increased by 1.6% for single-family homes in April compared to April 2021, and for townhouses and condos - by 4.06%. In fact, all the sought-after real estate - single-family homes, townhouses, and condos - were sold at the originally set price, without bargaining.
| Some counties of South Florida |
Single-family homes |
Townhouses and condos |
|---|---|---|
| Miami-Dade, Broward, Palm Beach |
+1.6% | +4.06% |
Table 4.The average value of the indicator "median percent of original list price received" in Miami-Dade, Broward, Palm Beach counties in April 2022 in comparison to April 2021
Median time to contract
If we talk about the median time to contract (the median number of days between the listing date and contract date for all Closed Sales during the month), then in April it decreased.
In Miami Dade County, for single-family homes in April 2022, a decrease occurred by 30% compared to the previous April 2021 years. For townhouses and condominiums, a decrease of 52.8%. In Broward County, there was a 14.3% decrease in single-family homes, and a 63.9% decrease in townhouses and condos. In Palm Beach County, the median time to contract for single-family homes is - 30.77%, and for townhouses and condos - 64.3%. On average, in three districts, the indicator we studied for single-family homes decreased by 25.02% in April compared to April 2021, and for townhouses and condos - by 60.33%. In fact, the median time to contract for single-family houses has decreased by a quarter, and for townhouses and condos - by 2 times.
| Some counties of South Florida |
Single-family homes |
Townhouses and condos |
|---|---|---|
| Miami-Dade, Broward, Palm Beach |
-25.02% | -60.33% |
Table 5.The average value of the indicator "median time to contract" in Miami-Dade, Broward, Palm Beach counties in April 2022 in comparison to April 2021
Median time to sale
Correspondingly, it is possible to observe a decrease in such an indicator as the median time to sale (the median number of days between the listing date and closing date for all Closed Sales during the month), in general, in three analyzed districts for single-family homes in April by - 14.27% compared to April 2021, and for townhouses and condos - by 28.56%.
| Some counties of South Florida |
Single-family homes |
Townhouses and condos |
|---|---|---|
| Miami-Dade, Broward, Palm Beach |
-14.27% | -28.56% |
Table 6.The average value of the indicator "median time to sale " in Miami- Dade, Broward, Palm Beach counties in April 2022 in comparison to April 2021
New pending sales
In April 2022, in three counties of South Florida, such an indicator as new pending sales (the number of listed properties that are under contract for a month) also tended to decrease by about 22% for both houses and townhouses and condominiums.
| Some counties of South Florida |
Single-family homes |
Townhouses and condos |
|---|---|---|
| Miami-Dade, Broward, Palm Beach |
-22% | -22% |
Table 7.The average value of the indicator "new pending sales" in Miami- Dade, Broward, Palm Beach counties in April 2022 in comparison to April 2021
Inventory/active lists
The "inventory/active lists" indicator (the number of active real estate listings at the end of the month) is important for assessing the events taking place. In April 2022, in Miami-Dade County, we could see a 13.8% decrease in the number of inventory in active lists for single-family homes compared to the previous April 2021. For townhouses and condominiums, a decrease of 51.5%. In Broward County, inventory reduction for single-family homes by 12.7%, and for townhouses and condos by 51.8%. In Palm Beach County, the index of active inventory for single-family homes is 2.53%, and for townhouses and condos - 40%. The total decrease in active inventory for the three districts in April was 9.7% compared to April 2021, and for townhouses and condos - by 47.7%.We can see a clear decrease in the inventory/ active lists for townhouses and condominiums, because due to the rise in the price of single-family individual houses, people are actively buying real estate in another more affordable segment.
| Some counties of South Florida |
Single-family homes |
Townhouses and condos |
|---|---|---|
| Miami-Dade, Broward, Palm Beach |
-9.7% | -47.7% |
Table 8.The average value of the indicator "inventory/active lists" in Miami- Dade, Broward, Palm Beach counties in April 2022 in comparison to April 2021
Month's supply of inventory
And another key indicator for assessing the residential real estate market in South Florida is the "month's supply of inventory" (an estimate of the number of months it will take to deplete current inventory, given the latest sales rates).
The situation regarding "months supply of inventory" is as follows. In April 2022, the month's supply of inventory for single-family homes in Miami-Dade County decreased by 13.6% compared to the previous April 2021. For townhouses and condominiums, a decrease of 67.6%. In Broward County, the decrease in monthly inventory supply for single-family homes by 14.3%, and for townhouses and condos - by 60%. In Palm Beach County, the monthly inventory supply index for single-family homes is 0%, and for townhouses and condos - 50%.
| Some counties of South Florida |
Single-family homes |
Townhouses and condos |
|---|---|---|
| Miami-Dade, Broward, Palm Beach |
-9.3% | -59.2% |
Table 9.The average value of the indicator "month's supply of inventory" in Miami-Dade, Broward, Palm Beach counties in April 2022 in comparison to April 2021
Analyzing this indicator, our expert NICK POLYUSHKIN suggests that if there are no new offers on the residential real estate market, then the existing inventory can be sold out in two months.
This review contains data from the Miami Association of Realtors for April 2022.